


Profiling Viewer opens and visualizes callgrind files. You can use Flamegraph, Treemap, Callgraph, flat or hierarchic lists to identify functions where your application spends more time than expected.
Highlights:
- Runs natively on both Apple silicon and Intel-based Mac computers
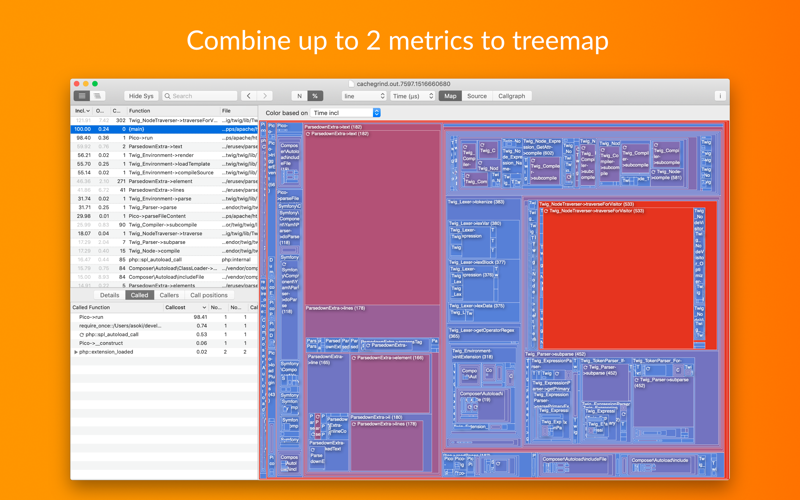
- Mix & Match: combine multiple cost types to construct a Callgraph, a Treemap or a Flamegraph
- Handles multiple costs and position types
- Supports reading gzip compressed profiling files
- Elegant reports for printing or as PDF with vectorgraphics
- Treemap with heatmap
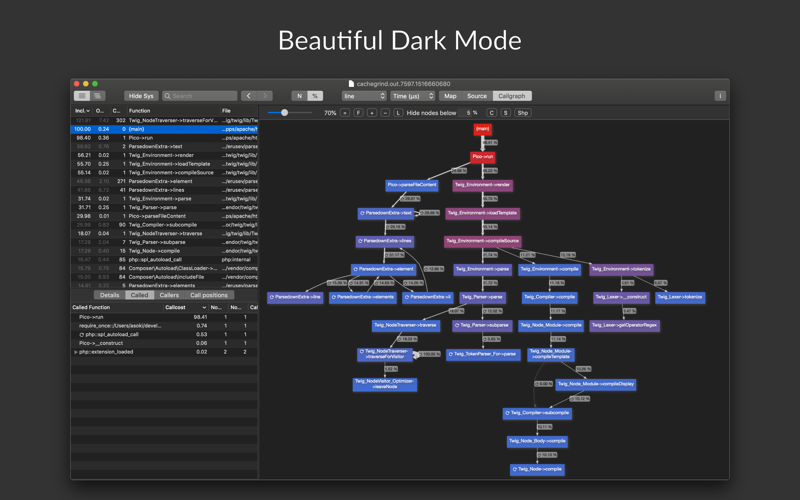
- Callgraph with heatmap
- Flame-graph classic or with heatmap
- System functions can be hidden based on customizable presets
- Compatible with Xdebug
- Beautiful Dark Mode
- Source lines annotated with costs
You can generate the required callgrind profiling data with various external tools available for many platforms and programming languages.
For example, you can open callgrind files generated by the Xdebug extension for PHP, Valgrind, Ruby ruby-prof, Python cProfile with pyprof2calltree, gperftools-pprof, golang pprof, node.js nodegrind and many other profiling tools with callgrind file output.
Features:
- Function costs visualized as Treemap, Callgraph, Flame graph and Lists
- Combine Treemap, Callgraph, Flamegraph with Heatmap
- Supports reading gzip compressed profiling files
- Elegant reports for printing or as PDF with vectorgraphics
- System functions can be hidden based on customizable presets
- Drill down through double-click, mouse over for details
- Source file Viewer annotated with costs and color marks
- Configurable source locations
- Displays costs as raw data or as percent
- Handles multiple costs and position types
- Shows cycles and recursions
- Sort data by costs, function name or filename
- Navigation history
- Parses compressed callgrind files
- Small memory footprint (for example, approximately 280 MB memory used to open and display a 4.6 GB callgrind file generated by xdebug)
The Callgraph view:
- is Zoomable
- Supports trackpad gestures like zoom in, zoom out, smart zoom
- Represents call costs by the thickness of connections
- Its complexity can be reduced by hiding functions with cost below a customizable preset
The Flamegraph view:
- is generated from a callgrind file
- has a virtual gray node with the cumulative cost of functions that are too small for the current screen resolution.
Profiling Viewer uses graphviz to layout and render callgraphs. Graphviz is licensed under the Eclipse Public License v1.0. You can download graphviz at http://www.graphviz.org